By F. Lempérière (Hydrocoop)
____
Summary:
At present the hydropower plants have a total capacity of 1 150 GW and generate yearly 4 000 TWh associated with 18 000 TWh of coal or gas electricity. In 2050, Hydro Power plants may reach 2 000 or 2 500 GW generating 7 000 TWh associated with some 40 000 TWh of variable wind or solar energy. Storage of electricity by Pumped Storage Plants (PSP) may be justified up to 3 000 GW capacity instead of 150 GW at present.
The utilization of rivers and reservoirs should be optimized accordingly between hydropower generation and storage. It may be very different from the present utilization.
Hydropower is presently associated with large amounts of fully-dispatchable coal or gas electricity. By mid century hydropower will be associated with much less coal or gas and much more variable wind or solar energy; it may thus be as useful for guaranteed capacity and energy storage as for generation. The best utilization of rivers and possible reservoirs should be reconsidered accordingly.
Three questions must be answered:
- How may the global energy and electricity landscape look like in 2050?
- How useful will hydropower be for generation and storage of electricity?
- What role may pumped storage plants (PSP) play in this context?
- The global energy and electricity in 2017 and 2050
All energies are assessed in kWh (or in TWh = 1 Billion kWh)
All power capacities are assessed in kW (or in GW = 1 million kW)
Costs are assessed in US $ and in cents of US $ per kWh
1.1. Energy in 2017
The total “primary energy” used yearly is of 15 billions tonnes oil equivalent. This is equal to 175 000 TWh, i.e. 25 000 kWh per capita for 7 billion people.
- A “primary energy” of 10 000 TWh is included in fuels (mainly oil) which are not used for energy but as feedstocks for various industrial products, notably chemicals.
- 65 000 TWh, mainly coal and gas, are used for generating 25 000 TWh of electricity and 40 000 TWh are turned into low-temperature heat in thermal plants, most of it useless.
- 100 000 TWh are used directly (not through electricity): 45 000 are from oil mainly for transport, of which over 30 000 are lost as heat in motors and vehicles, 35 000 are from gas and coal of which 5 to 10 000 are lost, 20 000 are from biomass and various sources and 10 000 are lost (for instance, most primary energy is wasted in traditional utilization in Africa or Asia). The total losses are close to 50 000 TWh and the useful energy is about 50 000 TWh
The total useful energy, i.e. the satisfied needs, is thus 25 000 + 50 000 TWh = 75 000 TWh in 2017 (10 000 kWh per capita). About 60 000 TWh are from fossil fuels.
1.2. Energy in 2050
The world population will increase by 40%, the extra needs are enormous in many countries and electricity will be available in all countries at a cost close to today’s and possibly lower; it will be mostly renewable. The global economic product will probably double between 2017 and 2050 and the useful energy will increase by at least 50%, reaching 110 or 120 000 TWh/year[1]
The primary energy which is presently 75 000 TWh useful + 100 000 TWh lost may be in mid-century: 110 or 120 000 useful + 50 000 TWh lost, i.e. will not increase.
The share of electricity in useful energy which is presently one third may well be two thirds by mid-century for 3 reasons:
- It is possible to use electricity for almost energy needs except a significant part of transports (liquid fuels) and of heavy industry (gas) and a small part of other needs.
- The biomass is far from being always sustainable and its potential is limited as well as that of solar heat. Their total practical potential seems to be in the range of 20 000 TWh; geothermal energy is important in some countries but quite limited worldwide.
- The key potential for using renewable energies rests in electricity-generating technologies, especially for the two virtually unlimited resources which are photovoltaics (PV) and wind, and for hydropower.
Rough calculations are made below for a total electricity generation of about 70 000 TWh in order to evaluate the value of energy storage by pumping storage plants (PSP).
A significant utilization of wind and solar appeared totally unrealistic 20 years ago, very expensive 10 years ago: it is now undoubtedly a very realistic option because these resources are considerable in many countries and the cost of wind and photovoltaic per kWh will be close to the cost per Kwh of fossil fuels or nuclear energy and possibly lower by mid century.
- The present direct cost of photovoltaic electricity (PV) varies worldwide from 4 to 10 cents/kWh with short term power purchase agreements and is still getting lower. In fact most of the relevant investment may be used during 50 or 100 years and, by mid century or before, the direct cost will probably be close to 2 or 3 cents in sunny countries and 5 cents in less sunny countries. The present direct cost of wind energy is between 4 and 9 cents/kWh and, for same reasons and progresses will probably be 3 to 6 cents/kWh by mid century. The cost of fossil fuel per kWh is for most countries between 2 and 10 cents (IEA, 2015) and will probably be in the same range as the direct cost of wind or PV energy by mid-century and possibly higher.
- How useful will hydropower be?
- For a country where all electricity is from fossil fuels, the thermal plants capacity should cover the peak of power utilization i.e. in the range of 50% over the average utilization. The investment for natural gas plants is usually 800 to 1 500 $/kW and the yearly cost for depreciation, financial cost, operation and maintenance in the range of 80 to 120 $ per kW. To express this cost per kWh (all kWh, not only peak kWh), it has to be multiplied by 1.5 to express the gap between average and peak, then divided by 8 760 hours, i.e. 5 to 2 cents per kWh to be added to the cost of fuel for a total in the range of 4-12 cents per kWh presently.
If solar or wind energy replaces a part of fossil energy it is necessary to keep a large thermal plants capacity because there may be little wind and solar energy during hundreds hours per year: the reduction of thermal capacity that would entail the same statistical risk of unserved electric load, called the “capacity credit”, is close to the capacity factor of wind turbines at low penetration rates but declines to about 5% at high penetration rates For solar PV, it is near zero in Europe, and rapidly declines to zero in California as increasing PV shares progressively push the net load peak beyond sunset (Denholm et al., 2016). The economical impact of this replacement thus mostly consists in the difference in cost per kWh between fossil fuel and the direct cost of wind or solar; such difference is more and more in favour of renewables and this replacement is a cost efficient solution for delivering electricity, while in surplus reducing CO2 emissions.
The key problem of the future world energy is thus the possibility of a very important share of wind and PV energy in the electricity by mid-century. Comparisons below are made first between gas, wind and PV before analysing the usefulness of hydropower for power supply and storage.
The hydropower investment for power supply is usually in the range of 1 000 to 1 500 $/kW with a yearly cost of 80 to 120 $/kW for 3 000 kWh/year i.e. 3 or 4 cents of $ per kWh.
The investment and yearly cost for a pumped storage plant (PSP) is usually 1 000 to 2 000 $/kW for storing water between two reservoirs in order to generate 10 to 20 hours at full capacity.
The possible use of nuclear, Biomass or geothermy is analysed separately (chapter 5).
The target of many studies is an electricity 100% renewable: this may not be the economic optimum and is not the target considered in this paper. The best way for reducing CO2 emission may be the lowest cost of electricity including 10 or 20% of thermal energy and its utilization to substitute fossil fuels in other uses such as domestic or industrial heat and transportation.
Problems and solutions are quite different according to the countries because needs and available energy sources are different. A wide country such as China or U.S. may have different climates and solutions.
Two examples are analysed below for conditions prevailing in many countries or areas. These examples are chosen because their basic data are very different.
2.1. The Sunny Countries
They are mainly between tropics and include Africa, Asia (beyond Russia and most China and Japan) and Latin America. The population will probably increase from 4 Billion now up to 7 Billion in 2050. The useful energy utilization is 15 000 TWh of which 5 000 TWh through electricity, i.e. 1 200 kWh per capita to be compared with 8 000 kWh in O.C.D.E. The key of development is an increase of electricity utilization up to 4 or 5 000 kWh per capita by mid-century. The example analysed below applies to most of these areas.
The sunny countries have usually much sun along 8 or 9 months of dry season, during which the peak demand may be for air conditioning. The basic solution is currently thermal electricity. As an example for a country using 10 GW on average, the peak of demand may reach 15 GW and this requires 15 GW of thermal plants and coal or gas for 10 GW x 8 760 hours = 87 600 TWh. It will be possible to use directly photovoltaic electricity during 8 hours per day at a cost per kWh close to the cost of fossil fuel and possibly lower. The corresponding utilization will be 40 or 50% of the 24 hours electricity utilization. It is a very attractive way for reducing CO2 emission but this will not reduce much the thermal plants capacity because the demand may peak at sunset.
Replacing 5 GW of thermal capacity by 5 GW of pumped storage plants (PSP) operating between two reservoirs seems attractive if the yearly cost of such PSP for depreciation and operation is not much higher than the yearly cost (other than fuel) of a thermal plant. If pumping 2000 or 2500 hours per year with an roundtrip efficiency of 80 % it will provide 5 x 2 250 x 0,8 # 9 000 TWh, about 10 % of the annual demand. It is thus possible to increase the contribution of PV up to 50% or 60% of the annual demand at an attractive cost.
It will be also possible in these countries to use on average over 10% of hydropower energy. This will be especially useful if the hydropower capacity may be used during the annual demand peak of the dry season: their capacity which substitutes thermal plants may then be increased.
Wind energy may also be used in many countries and on average will supply 15% of demand.
The share from fossil fuels is thus reduced to about 20%.
It is possible to increase over 5 GW the PSP capacity and to use more P.V. but it is necessary to keep a large thermal plants capacity and, beyond 5 GW, PSP extra capacity would not replace thermal plants and the cost per relevant kWh should be higher but possibly acceptable.
For a sunny country using as average 10 GW of electricity for producing 87 600 GWh/year, a storage capacity of 5 to 7 GW of storage along 10 to 15 hours seems cost effective.
It will store yearly 10 to 12 000 GWh of renewable energy replacing fossil fuel energy for 10% to 15% of the total electricity.
The potential for hydropower and PSP is usually important in sunny and “wet” (tropical) countries; in even sunnier but arid or semi-arid countries, the availability of hydropower is often much constrained. Another option then might be concentrating solar power plants with built-in thermal storage, able to deliver electricity on demand in particular during after-sunset demand peaks.
2.2. The Windy Countries
They are essentially Europa, China and U.S., i.e. 3 billion people now and probably the same by mid-century. Most may be evaluated by the example below.
They need 50 000 TWh of useful energy of which 20 000 TWh as electricity. The total energy will increase in China and the share of electricity everywhere.
The electricity utilization will thus probably increase up to 30 000 TWh/year by mid-century for favouring renewable energies.
These countries are 3 000 to 5 000 km North of the Equator, with much more solar energy available in summer than in winter ; there is wind in quite all these countries, especially in winter season and an association for variable energy of 2/3 – 3/4 of wind energy with 1/3 – ¼ of solar energy seems advisable. Ten per cent of demand will be available on average from hydropower especially during the winter peak of demand.
Large balancing areas can associate wind energy from various areas. A grid supplying on average 100 GW may be an example, such as for Western Europe or part of China or U.S. Two solutions may be compared, with or without storage, and are represented on fig 1. In both solutions, it is accepted that 10% of the wind and solar energy available is curtailed (wasted), or lost through storage.
In both solutions, the total energy used annually will be 100 GW x 8 760 hours i.e. 876 TWh. As the available wind or PV energy may be very low during hundreds hours per year and possibly at the demand peak at sunset, a firm capacity should then be available for the demand peaks, in the range of 1.5 x 100 GW = 150 GW. As average hydropower will supply 100 TWh from 30 GW capacity and capacity close to 150-30 = 120 GW should be from thermal plants or storage (PSP or batteries).
Comparisons are made between a solution without storage with 120 GW of thermal plants and a solution with 70 GW of thermal plants and 50 GW of storage capacity.
The example of 100 GW of average supply is for an area in the range of 1 million km² for such an area the peak of corresponding available total energy is about 2,5 the average corresponding supply and is represented by the fig.1.
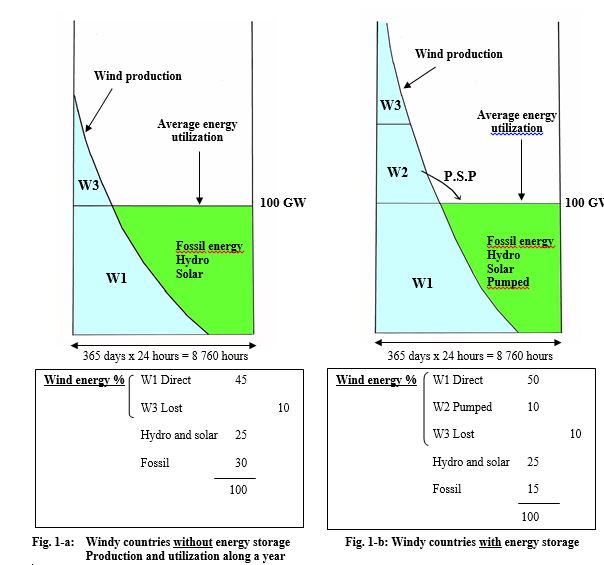
Fig. 1-a: Windy countries without energy storage Fig. 1-b: Windy countries with energy storage
Production and utilization along a year
A solution without storage may include 60% of wind and PV energy. The cost will include for 10 kWh: the direct cost of 7 kWh of wind and PV energy (of which 1 kWh unused or lost) and the cost of gas supply for 3 kWh, a total close to the unit cost of wind or PV for 10 kWh.
And it will include the yearly cost of 150 GW of hydropower or thermal plants (other than fuel costs); about 150 GW x 80 millions $, i.e. 12 billions $ for 876 TWh – about 1.5 cent of $ per kWh. The cost of electricity supply per kWh will thus be about the direct cost of wind energy plus 1.5 cent of $.
The alternative solution will increase the wind and PV energy from 60 to 75% of the total demand and will accordingly reduce the fossil energy from 30% to 15%. About 5% more are used directly and 10% through storage: the storage capacity may be 50 GW (50% of average demand) storing 25% of the time, i.e. storing 12.5% of the yearly energy with 20% losses.
There are 3 differences in cost between the 2 solutions:
- 2% losses though storage.
- Replacing 15% of kWh from gas by 15% of kWh from wind or PV. Unit costs will be about the same in 2050.
- Replacing 50 GW of thermal plants yearly cost (other than fuel) by the annual cost of 50 GW of PSP.
The main difference may then be the yearly cost per kW of PSP as compared with the yearly cost per kW of a thermal plant. Its impact may be plus or minus one cent per kWh. An investment of 1 000 $/kW of PSP. seems very attractive and 2 000 $/kW acceptable.
The total supply of wind and PV may be well under the average along one or two weeks and the cost of storage is rapidly increasing beyond one day. It is thus advisable to keep a total capacity of thermal plants and traditional hydropower close to the average demand of 100 GW. Beyond about 50 GW, a PSP would not replace a thermal plant and the cost per relevant extra kWh would be higher (possibly by 3 or 4 cents per kWh).
To sum up: as far as the share of wind and PV is not over 50% of electric supply, the interest of extra PSP is limited. They may be very useful for increasing this share and to reduce from 30 to 15% the share of fossil electricity but reducing this share under 15% may be more expensive and difficult under 10% except where the hydropower resources are very important.
As for sunny countries a storage capacity of 50 to 70% of the average electricity utilization seems cost effective for using renewable energy instead of fossil fuel energy for 15% of the total electricity.
2.3. Total usefulness of storage by P.S.P.
Presently the world capacity of PSP is 150 GW, i.e. 5% of the average electricity supply close to 3 000 GW. These PSP are mainly used for peaks of electricity utilization along few hours and for adjustment to quick changes in power needs or availability: they accordingly favour frequency control. Such PSP utilization may increase with the total electricity supply and thus reach up to 500 GW along few hours, i.e. in the range of 1 000 GWh to 2 000 GWh of storage capacity.
Mid-century a much more important need of PSP will be linked with solar and wind energies. For each country it is possible to evaluate precisely and to optimize this utilization if comparing according to the meteorological data of a past year the possible wind and solar production with the needs at same hour.
The rough evaluations presented above for the “sunny countries” and “windy countries” have similar results: storage may be useful and cost effective for a capacity in the range of 50% of the average electricity supply along 15 to 20 hours, i.e. a storage capacity of one or two per thousands of the yearly energy. These two categories are representing most countries and may be taken as basis for a rough global evaluation.
- For a yearly electricity supply of 70 000 TWh mid-century, i.e. about 8 000 GW as average, the storage capacity could reach up to 4 000 GW. Smart grids and demand side management may reduce the peaks of utilization, but not much under the value used above of 1.5 the average utilization.
Batteries may be used for a part but mainly along few hours, and thermal storage in CSP plants may also provide solutions in most arid countries.
A reasonable hypothesis might be 3 000 GW of PSP storing 15 to 20 hours, i.e. in the range of 50 TWh for using yearly 6 000 TWh of renewable energy instead of fossil fuel; an acceptable investment of PSP is in the range of 1 500 €/kW.
Half may be in Asia, 20% in Europa, 20% in America, 10% in Africa. The usefulness of storage is much lower as long as the share of wind and solar is under 40 or 50% of the total demand. Development of PSP will thus be probably important mainly after 2030.
- Which PSP?
A total storage capacity of 3 000 GW x 15 or 20 hours, i.e. 50 TWh may be justified worldwide for using 6 000 TWh of renewable energy instead of fossil energy. The corresponding extra cost of PSP as compared with thermal plants seems nil for an investment per kW of 1 000 $ to 1 500 $, acceptable for 2 000 $/kW.
It may be associated with 2 000 to 2 500 GW of traditional hydropower supplying 7 000 TWh. The rough evaluation of 3 000 GW of PSP is for a yearly electricity utilization of 70 000 TWh. It may be quite proportional to this yearly utilization.
Three key solutions may be used for PSP:
3.1. Traditional solutions operating between two reservoirs linked by a tunnel. The reservoirs may be created by dams or off rivers. There are presently 400 hundred such sites, with heads between the two reservoirs usually of 100 to 1 000 m. the total capacity is 150 GW for 5 or 10 hours, i.e. 1 TWh as compared with future needs of 50 TWh. Many sites are available and many sites presently used for power supply may be adapted to storage by adding a second reservoir and increasing the tunnels capacity. See for example the JRC study for Europe (Gimeno-Gutiérrez and Lacal-Arántegui, 2016). The area for reservoirs is five or ten km2 per GW much lower than for electricity generation which requires as average 100 km² per GW (400 000 km² for 4 000 GW).
However this solution is not adapted to rather flat countries.
3.2 Twin Dams
It is possible in many large rivers to associate two adjoining reservoirs of similar capacity V (m3) and height H. (m) (fig.2).


Fig.2: Longitudinal section of twin dams reservoirs
The upper part of each reservoir such as about 0,2 H stores 50 % of V; exchanging these upper parts under an average head of 0,8 H with an output of 0,8 stores an energy (in kWh) of:
0,5 V x 0,8 H x 0,8 x g / 3600 # about 0,9 HV/1000.
If it is used 200 times per year, the yearly storage will be in kWh close to 0,2 VH
For a dam height of 25m, the yearly storage is 5 kWh per m3 of reservoir, i.e. 2,5 kWh per m3 of the two reservoirs. If the 2 reservoirs have not the same volume V, the reference should be the volume V of the smaller reservoir.
As comparison, 4 000 TWh/year of electricity are presently supplied by Hydropower reservoirs storing 6 000 Billion m3, i.e. about 0.7 kWh per m3 of reservoir but it varies much with each site and may be less than 0,1. Many rivers may then be more useful for storage than for power supply and many sites may be used for both purposes: it may be much better to use along a river a total available head H for two adjoining dams of height 0.5 H instead of one dam of height H. The inundated area is halved.
It may be even advisable to replace an existing very large reservoir by two smaller. An example is the Kariba reservoir in Africa storing 150 billion m3 with a 100 m dam height. The present power supply is 7 TWh; replacing it by 2 reservoirs storing each 15 billion m3 with a 50 m high dam would store yearly 0.2 VH, i.e. 150 TWh. This storage capacity is beyond the needs of Southern Africa but using this lake for a capacity of 20 GW storing 50 TWh/year from a total PV yearly supply of 100 TWh/year may be an attractive solution (fig.3). It is the yearly production of the world’s largest hydropower schemes such as Itaipu or Three Gorges.
The Akosombo reservoir in Ghana has the same possibilities. Many rivers which are not yet used for hydropower in sunny countries could well use this solution which adds the power supply in rainy season to the power daily storage in dry season.
Bulb units may be a solution for many sites.
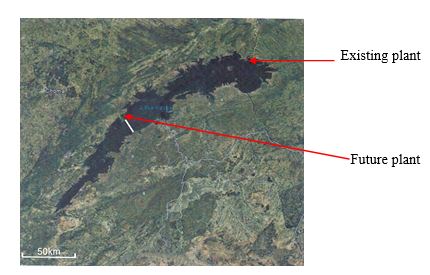
Fig.3: possible optimization of Kariba Lake utilization
The investment per kW will be in the range of 1 000 $. As there is no tunnel between the two reservoirs, the adjustment is easier for the possible huge changes in power supply or utilization. It is also possible to add a reservoir close to an existing one or to associate along a river more than two reservoirs.
The total world potential seems to be above 500 GW.
3.3. Offshore PSP (a.k.a. Emerald Lakes)
80% of the world population is living within few hundreds km from the sea and there is rock along dozens thousands km along shore, often as cliffs which are dozens or hundred meters high.
For such cliffs there is usually rock within some kilometers onshore and 10 or 20 m under the sea level within some km offshore.
This has three advantages for lowering costs:
– Low cost civil engineering for PSP plants.
– Sound foundations for dykes.
– Low cost materials for rockfill dykes and for concrete.
The cost per kW of the electro-mechanical part is linked with the head; this head will be most often 50 to 100 m; pumps and turbines may be standardized worldwide and the conditions for construction rather favourable. A relevant cost of about 500 $/kW is likely. The cost per kW of civil engineering of the plant may be 200 $/kW.
The cost per kW for the high basin varies with the cliff data and with the P.S.P. capacity. Three examples are commented below.
3.3.1. High basin on top of a cliff (fig.4)
An example may be a circular basin 1 km diameter with an average depth of 25 m (between 0 and 50 m), 100 m above the sea level. The stored energy with a roundtrip efficiency of 80% is:
0,8 x 3,14 x 1 0002 /4 x 25 x 100 m x g / 3 600= 4,5 x 10⁶ kWh
i.e. 300 MW during 15 hours. It requires a 3 km long dyke, totalling 5 million m3 for 100 millions $ and possibly a waterproofing of 800 000 m2 x 50 $ = 40 millions, i.e.140 millions $ for 300 MW or about 500 $/kW.
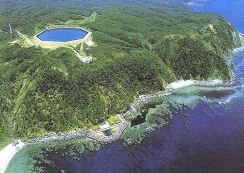
Fig.4: P.S.P. of Okinawa in Japan
3.3.2. High basin on a low level rock shore
For an average rock level of +30 above the sea, a 2 km diameter basin with a 40 m high dyke could operate between levels 40 and 70 with a stored energy of:
0,8 x 3,14 x 2 0002 x 30 x 50 m x g # 11 x 106 kWh
or 700 MW along 15 hours. The dyke volume will be 20 millions m3 for a cost of 400 millions and the cost of waterproofing 3,2 millions x 50 = 160 millions, i.e. a total of 560 millions for 700 MW or 800 $/kW.
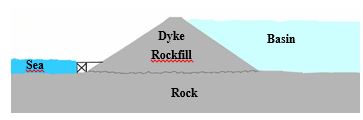
3.3.3. Offshore high basin along a cliff (fig.5)
A same operation as above may be foreseen between levels 40 and 70 above the sea level. As example the area of the high basin is increased to 9 km2, corresponding to 2 GW. The dyke is 7 km long and 80 m high, with a total volume of 70 million m3 for a cost of about for 1.4 billion $ for 2 GW, i.e. 700 $/kW. No waterproofing of the sea bed is necessary.
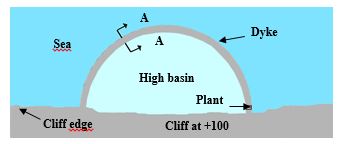
Plan of P.S.P. attached to a cliff
Dyke cross-section between sea and cliff
Fig.5: Marine P.S.P.
3.3.4. Overall cost/kW of P.S.P. at sea
It includes:
– The cost per kW of electro-mechanical equipment: 500 $
The cost per kW of civil engineering of plants: 200 $
– The cost per kW of high basin: 500 $ to 800 $…..
1 200 $ to 1 500 $
These are very rough evaluations but a cost between 1 000 and 2 000 $/kW appears likely, as well as an average cost under 1 500 $/kW.
The potential of offshore PSP is unlimited.
The on-shore area of reservoirs is under 5 km2 per GW.
- Worldwide investment for electricity and P.S.P.
60 000 TWh may be supplied mid century by wind, P.V., hydropower and fossil fuels. For an average power supply of TWh 60 000/8 760 hours # 7 000 GW, the need of peaking capacity will be close to 10 000 GW and wind and P.V. energy may be very low sometimes during demand peaks.
The hydropower traditional plants availability may increase up to 2 000 GW. It is thus necessary to have a capacity of 8 000 GW of thermal plants or PSP or other storage forms.
Their yearly cost per GW for depreciation and operation may not be very different. A minimal capacity of thermal plants of 4 000 or 5 000 GW seems necessary because the PSP are expensive for storage above 20 or 30 hours of full load; a capacity of 5 000 GW of thermal plants and 3 000 GW of PSP seems to be a reasonable hypothesis, not accounting for the share batteries, demand side management and thermal storage can take.
10 000 GW of plants available at peak time will thus include:
– 5 000 GW of thermal plants of which most will be new, i.e. an investment
of 3 or 4 000 GW at an average cost of 1 000 $/kW, i.e. 3 500 billion $
– 2 500 GW of traditional hydropower plants of which 1 300 GW new for 1 500 billion $
– 3 000 GW of PSP of which 150 GW are existing and many
may be associated with supply plants, i.e. an investment of
2 500 GW at 1 200 $/kW = 3 000 billion $
The total relevant investment is 8 000 billion $ for 60 000 TWh/year, i.e. 13 cents per yearly kWh, and a cost per kWh of about 1 cent.
The main investment is in fact the investment for:
– 10 000 TWh/year of fossil fuels, financed by private companies.
– 50 000 TWh of wind and P.V. (60 000 – 10 000 – 7 000 hydropower = 43 000 plus losses and curtailed energy).
The investment for 50 000 TWh may be 25 000 GW at an average cost per kW of 1 200 to 1 500, i.e. 30 to 35 000 billion $ to be financed by private companies.
The total investment for hydropower supply and storage is thus important, 4 or 5 000 billion $, but it is only ten per cent of the overall investment for energy
The investment for hydropower is presently under 50 billion $/year. It will probably not increase much before 2030 because PSP are mostly useful when the share of wind and P.V. is high; but it may reach 150 billion $/year in 2040 or 2050.
- Other energy resources
In most countries the wind, PV and hydro energies associated with 10 or 20% of thermal energy may meet by mid-century all electric needs for an acceptable cost per kWh.
Other solutions may be available in many countries for similar cost:
- Technically the nuclear energy may supply five per cent of electricity needs along the century with the present technology and much more after 2050 with solutions under implementation. This solution appeared to be the basic solution 30 years ago but the accidents are increasing the requirements for safety and the cost of nuclear which will probably be in the future higher than the cost of renewable: mid-century the nuclear production will probably not be much higher than the present 2 500 TWh, some 5% of future electricity utilization.
- Bio-fuels and waste are 10% of the primary energy. They are partly renewable and emit less CO2 than fossil fuels. They are essentially used for heating, with very huge losses in Asia or Africa.
They may be useful in Northern countries for dispatchable electricity supply but their possible world electricity supply seems to be under 1 000 TWh mid-century.
- Concentrated solar power is more complex than PV, but has the advantage of possible energy storage. Its potential is important in desertic areas but the very low future costs of PV in such areas reduce the probable utilization of CSP to very specific places and to a low world supply.
- Geothermal energy is very cost effective in some areas, usually for heat or cogeneration of heat and electricity at an attractive cost. But these areas are limited and the usual temperature more adapted to heat than to electricity. It will probably supply less than 1% of the world electricity.
- Marine energies have a very huge potential and offshore wind farms will probably be a large part of wind energy.
The waves energy potential is very important but most trials have been very deceiving and there is little hope of a significant production at an acceptable cost.
There is a technical potential for hundreds TWh worldwide of in-stream turbines but the likely cost will probably remain too high.
Tidal energy by water storage in very large basins has a huge theoretical potential and new approaches favour cost effective solutions; the impacts on shore may be very favourable and there is a reasonable probability of implementation. However for various practical reasons the cost effective potential seems limited to two per cent of the world electricity mid-century.
To sum up, all the solutions above may be significantly locally but will not total over 10 000 TWh/year mid-century. They will not much impact the world usefulness of energy storage as evaluated above.
- A 100% renewable electricity?
Achieving 100% renewable electricity should not be considered as an objective per se, independent from the broader energy mix and associated greenhouse gas emissions. A sound climate mitigation strategy will use low-carbon electricity to substitute to fossil fuel use in consumption sectors – buildings, industry and transports. Over time though, it will be suitable to further decarbonisation to zero net emission levels.
However, in all end-use sectors as well as in the power sector, combustible fuels will remains difficult to substitute in a variety of specific usages, such as balancing plants, high-temperature industrial heat, and long range maritime, aerial and perhaps terrestrial transportation. Carbon dioxide and storage or reuse, as well as bioenergy and biofuels, will have a role to play but new options are emerging as a result of the recent sharp reduction in solar PV and wind power costs. Producing hydrogen in world’s areas with immense and strong solar and wind resources, then shipping hydrogen chemically-bound in a diversity of energy carriers or fuels, such as ammonia and others, to areas with high demand and lower-quality resources, is getting progressively recognised as workable solutions towards full decarbonisation.
- Conclusion
Presently 25 000 TWh/year of electricity are mainly supplied from fully dispatchable coal or gas energy. Hydropower is supplying 4 000 TWh by 1 150 GW of generation plants and is storing yearly 300 TWh by 150 GW of PSP mainly used for frequency control and short peak of utilization.
By mid-century the electricity demand will possibly reach 70 000 TWh/year, mainly provided by variable wind and solar energy.
Hydropower may supply 7 000 TWh by 2 000 or 2 500 GW of generating plants; it will be probably cost effective to store yearly 5 to 7 000 TWh of renewable energy with up to 3 000 GW of PSP. PSP will thus reduce accordingly fossil fuel use and associated CO2 emissions. A part of PSP may be offshore and this potential is unlimited but a large part may be in mountains or along rivers. The utilization of rivers and mountain reservoirs should be optimized between energy supply and storage; this optimization may be very different from the present utilization.
The present world cost of a kWh is roughly the cost of fossil fuel per kWh plus 2 cents of US $. Mid-century the cost of kWh will probably be the direct cost of a kWh of wind or PV electricity plus 2 cents of US $. The capacity is unlimited.
The share of combustible fuels in electricity will be reduced from 80% now to 10% or 15% in 2050. At that time it could be provided by hydrogen-rich, renewable-based synthetic fuels, while fossil fuels will likely play such role in the years to come.
Acknowledgements
This paper has much benefitted from comments and inputs by Cédric Philibert, senior analyst of the Renewable Energy Division at the International Energy Agency.
References
Denholm, Paul, Kara Clark and Matt O’Connell (2016), On the Path to SunShot: Emerging Issues and Challenges in Integrating High Levels of Solar into the Electrical Generation and Transmission System, Golden, CO: National Renewable Energy Laboratory, NREL/TP-6A20-65800.
Gimeno-Gutiérrez, Marcos and Roberto Lacal-Arántegui (2013), Assessment of the European potential for pumped hydropower energy storage, European Commission Joint Research Centre, Institute for Energy and Transport, Petten, The Netherlands.
International Energy Agency (IEA) (2017), Energy Technology Perspectives 2017, OECD and IEA Publishing, Paris.
IEA (2015), Projected Costs of Generating Electricity, 2015 Edition, OECD and IEA Publishing, Paris.
IEA (2011), Solar Energy Perspectives, OECD and IEA Publishing, Paris.
[1] These numbers are roughly consistent, but not directly comparable, with those of the 2 Degree Scenario of IEA, 2017, which provides for estimates of “final energy”, a concept distinct from that of “useful energy” used in this paper. IEA 2011 also offer useful points of comparison.